
 PARCC
PARCC
SAT
ACCESS
ISA
Fitness Tests
MAP
AIMSweb
DLM
Running Records
KIDS….
If you are like me your heart rate just increased! These are just a few of the many assessments we administer and students are required to take each year (some three times a year!).
Please don’t get me wrong, I am a HUGE advocate for using data to drive instruction; however, what data actually does drive instruction? How are we using this data to improve our school?
 I have had the pleasure of being a part of countless data team meetings (no that wasn’t sarcasm). I LOVED attending data team meetings! I thoroughly enjoyed discussing student progress, looking at data and comparing it to what was observed in the classroom, then making informed decisions on how to best meet each student’s needs (not just the students who fell behind the benchmark)!
Unfortunately, I have also been a part of data teams that did not have similar dialogue. Instead, teachers were coming to the meeting worried about their data, feeling that it was an evaluation of their teaching and not wanting to have the deep conversations about instruction and best practices.
 I get why some would dread these meetings, in most districts this data gets projected and analyzed at board meetings, publicized for all to see in newspapers, etc., it feels very personal to teachers as we take what we do very seriously. What isn’t shown during these public displays of data is the individual growth each child made, the social emotional obstacles children face daily that impact their learning, let alone test anxiety that impacts these data points, just to name a few.
There are four different types of data: (ASCD: Educational Leadership V50 #5, Feb. 2003)
- Demographic – Describes the students, school staff, community information, etc. This data breaks down what impact the educational system is having on different groups of students
- Student Learning – This type of data comes in many different forms from standardized assessments, norm-referenced tests, classroom/district assessments, etc. Student learning data assesses the impact of your educational system on your students.
- Perceptions – Perceptions data is gathered through observations, conversations, questionnaires, & interviews. This data point helps you understand what others think about the learning environment. It is important to know what the perception of a certain topic is in order to change a person’s opinion or belief.
- School Processes – Data which includes school’s instructional strategies, assessment strategies, programing, etc. Looking at the longitudinal school processes data can help build a fluid continuum of learning Pre-K-12th grade for all students.
We need to be gathering and analyzing all types of data in order to get an accurate picture of our classrooms, buildings, and districts.
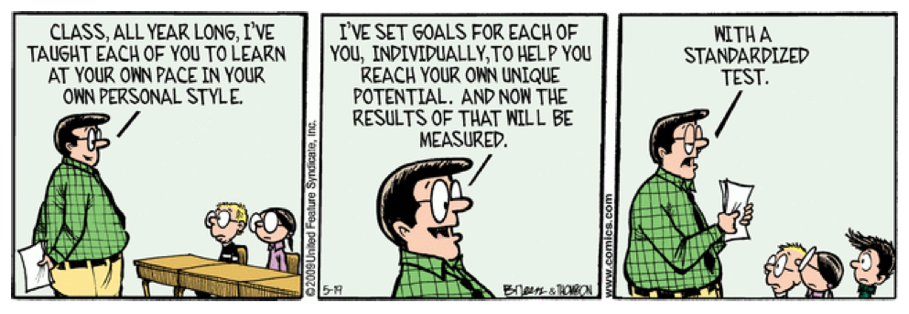
We have amazing teachers, administrators, and support personnel who work extremely hard to provide the best education possible to all students. One benchmark or standardized test does not accurately reflect the successes that occur each day within our buildings. So before start having heart palpitations thinking about the next round of data that will be shown, take a deep breath and ask yourself what type of data is this? What is this data showing me? What does this data show me I/we are doing well? Where is there room for growth? Then….
Go back into your classroom and continue to do the best you can for your students making minor changes to your instruction to reflect what the data is showing you.

Katie Algrim – Director of Innovative Professional Learning
(t):630-444-3044
(c):630-675-4447
(e):kalgrim@kaneroe.org